These days, there are unexpected developments, especially in the US stock markets. The most important of these seem to be ARM and NVIDIA shares. After ARM stock experienced a 100% rise, NVIDIA’s value reached $740 and became more valuable than China’s entire stock market, which particularly pushed the NASDAQ and SP500 indices up. In this article, I will try to interpret the impact of USA’s macroeconomic decisions on the index.
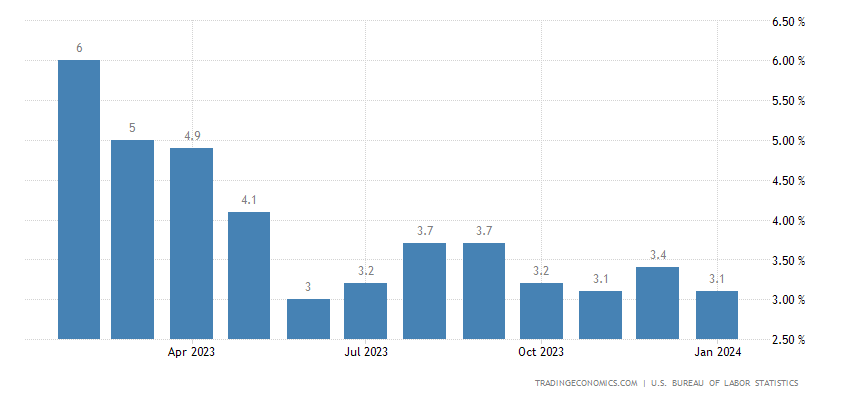
First of all, I think it is right to start with the inflation figures of the USA. US inflation data came in above expectations this month. Annual inflation was 3.1% while 2.9% was expected; Monthly inflation was expected to be 0.2% but 0.3%; Monthly core inflation was announced as 0.4%, while it was expected to be 0.3%. Before moving on to the effects of these statements on the stock market and bonds, I would like to share with you my expectations on the items that cause inflation to be so bad.
I said that the decline in energy prices continues. This is a very positive factor on inflation and gasoline prices in the USA are still below 3 dollars. Biden will do his best to keep that low in an election year. Therefore, this item seems to have a further lowering effect on inflation. Food prices have increased, which will have a negative impact on inflation, but the important thing is the core. There are 2 big items for the core: “Commodities less food and energy commodities” and “Services less energy services”. These items also recorded a monthly decrease of 0.32%. Again, it stands out as a positive development. Negative items were housing, with an increase of 0.63%, and transportation, with an increase of 0.97%. In other words, the possibility of the Fed keeping interest rates constant on May 1 has increased. I think this is not bad news because the FED and the market are on the same page. Expectations are now much more similar. The market expects almost 3 interest rate cuts from the FED for June and beyond. In addition, inflation is no longer at alarming levels. As for the dangerous housing item, the expectation is that no one wants to sell their house because the interest rates are high. Nobody wants to get out of a loan with 3-4% interest and move to a new house and get a loan at 6-7%. So there is demand, but supply is low. When interest rates decrease, mortgage interest rates will also decrease, and the number of people selling their homes will increase. So balance will be achieved. Therefore, there is actually nothing to fear here.
So why did I get into the subject specifically about inflation? The reason for this is that inflation closely affects 10-year bonds.
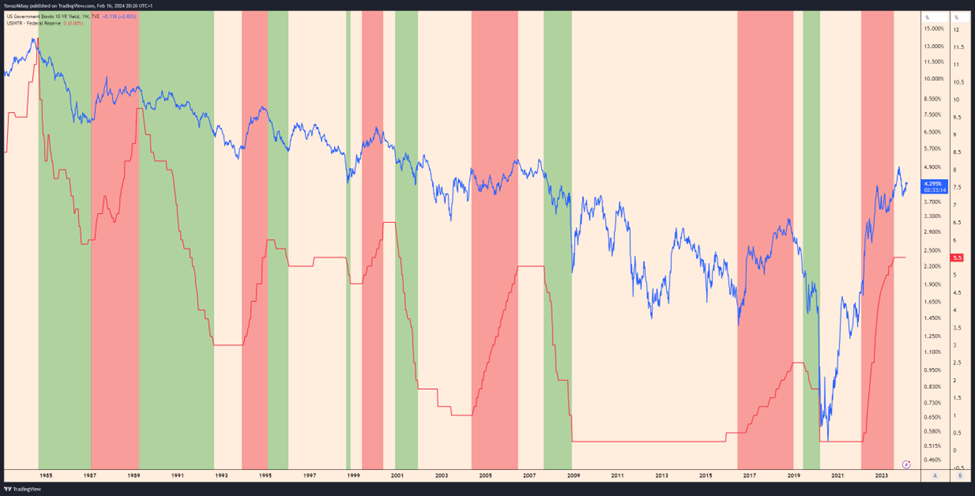
The blue lines on the chart represent 10-year bonds and the red lines represent interest. While interest rates are gradually increased in red areas, interest rates are gradually decreased in green areas. In vacant areas, interest is kept constant. In the red and green areas, interest directly affects 10-year bonds positively. In empty areas, the movements of 10-year bonds are shaped according to the market’s inflation and therefore interest expectations, taking into account macroeconomic conditions.
Therefore, as I said at the beginning of the article, considering that inflation no longer scares the market and that it is getting better day by day, I can predict that it is unlikely that 10-year bonds will retest the 4.9% peak, at least until June, and that it will gradually return to lower levels. Now let me talk a little about the critical correlation between 10-year bonds and the SP500 index. In fact, it would not make sense for me to say that there is a positive or negative correlation between 10-year bonds and the SP500 index, because there are cases in history where this correlation is positive or negative. However, it seems that it is possible to see a clear negative correlation, especially if we pay attention to the period after 2022.
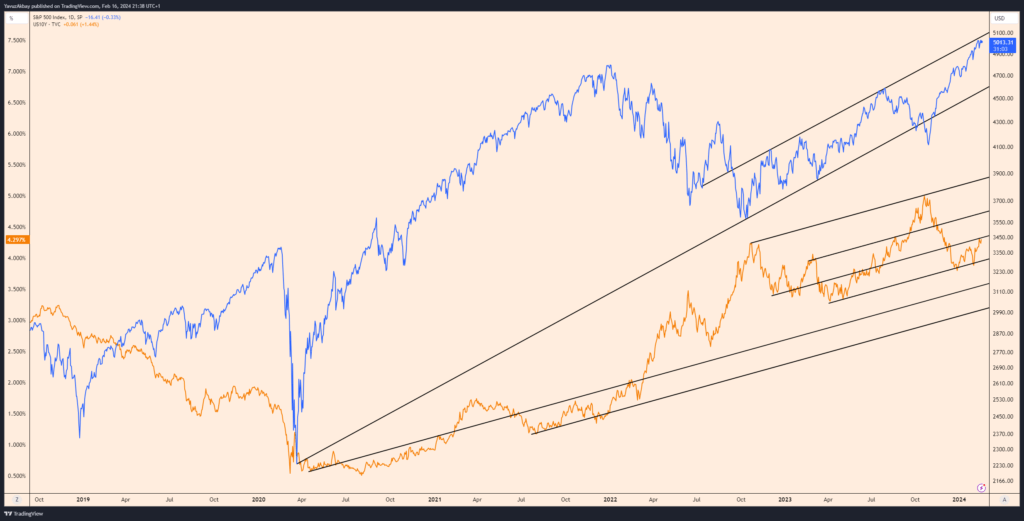
SP500 index is in an upward trend. The resistance point of this trend currently appears to be $5100, while the support point is approximately $4650. Likewise, the 10-year bond is also in an upward trend, and this trend is in the form of a channel. The channel has various support and resistance points. It is actually this graph that will determine what kind of market environment we will encounter on a macro basis, especially in terms of interest rate cuts. Since I find it more appropriate to present this graph in a tabular form, I would like to explain it through a table.
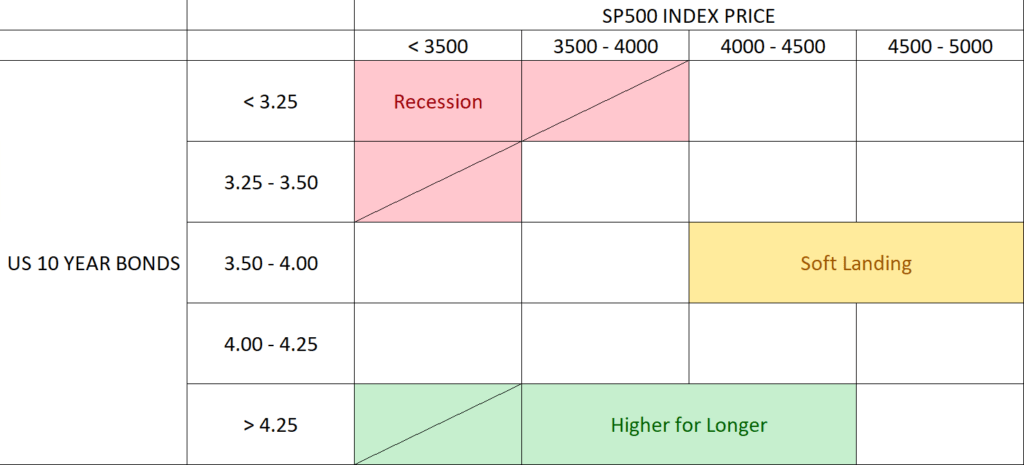
In the upcoming period, if 10-year bonds fall to the 3.50-4.00% range with the decline in inflation, keeping the SP500 index above $4000 will allow the FED to make a soft landing. This is the region we currently want to hold until June. However, if the 10-year bonds do not fall, on the contrary, they rise, and in this process the price of the SP500 index begins to fall, breaking the upward trend I have specifically mentioned, this may cause the interest rate to remain at the top for longer periods of time. The worst-case scenario, unfortunately, is a recession. If 10-year bonds break most of the support levels I just mentioned and fall to 3.25% or lower, if the SP500 index shares this decline with a positive correlation, the reductions in interest rates will create a harsh recession. Regions other than these areas are no-landing areas. Therefore, it will not be possible to expect a reduction in interest rates in regions other than these regions. We can confirm this with a few graphs.
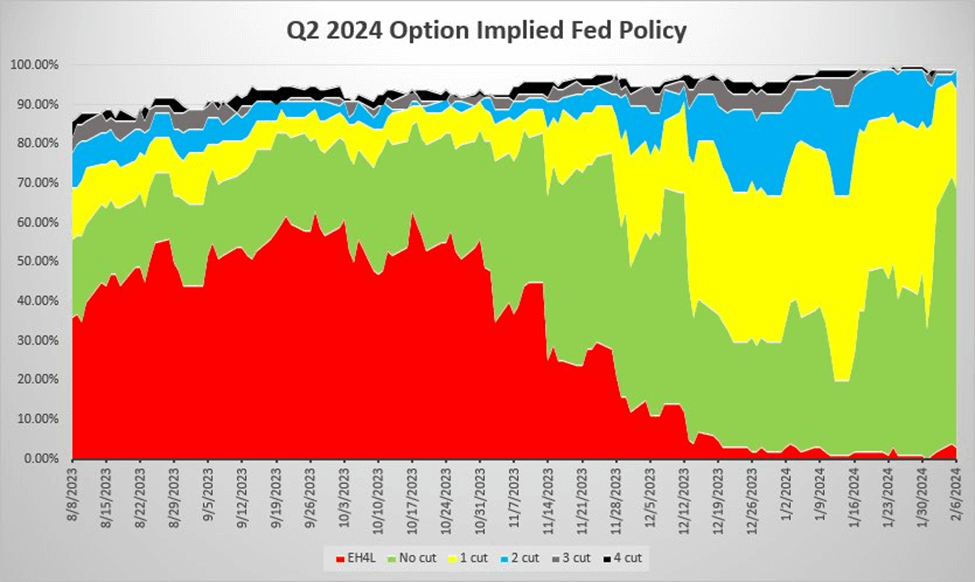
As seen in this chart, as of the beginning of February, the number of investors who think that the FED will not reduce interest rates in the second quarter has exceeded 60%.
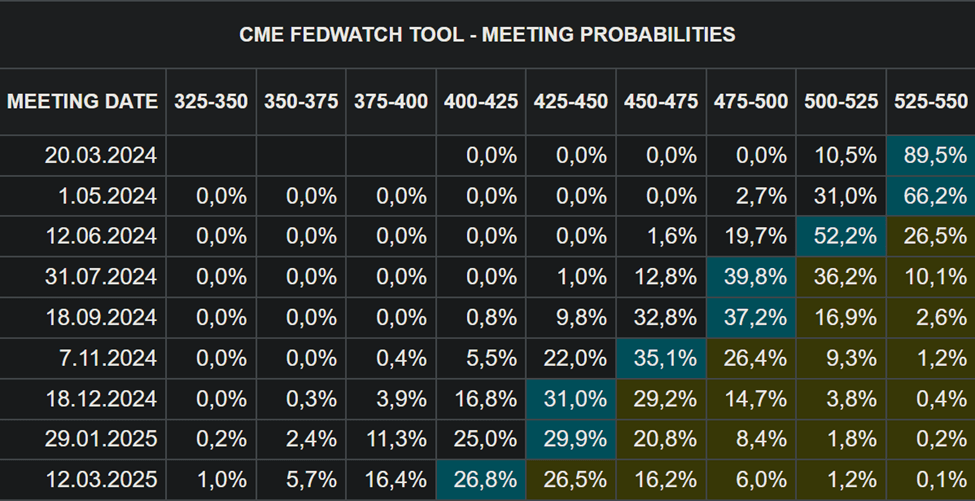
In addition, it is clearly seen in CME’s FEDWatch tool that the market thinks that interest rates will start to be reduced only in June. We see that the decline is almost certainly expected in the 3rd quarter. Although we do not expect interest rate cuts in these time periods, if we look at the table I shared when the interest rate cuts start, we will have a much better understanding of what kind of landing we will encounter.
At this point, most of the stronger pricing for the longer dynamic is priced in. There will probably be a little more pricing after the Fed eases. In this process, I think bonds will loosen and the index will move towards dangerous areas. Of course, the gap between the index and the bond will widen, but one must be very careful because there is no easy money anymore. We have just started the year, but markets have priced in a stronger FED for a longer period of time. I think it’s time to reduce earnings from now on.
Cryptocurrency investors, in particular, need to follow this decline with great care. If the market is in the recession section shown in the table and the FED has started to reduce interest rates, as I just mentioned, it means that the recession has clearly arrived, and this makes cryptocurrencies such as Bitcoin, which have not seen a proper recession, uncertain. However, in the market that is in the soft landing section, the FED’s interest rate reduction will also affect Bitcoin positively.
I hope our landing is as soft as possible.