In this article, I will basically analyze the data of cryptocurrencies in general and help you invest more efficiently in the markets by identifying overvalued or overvalued cryptocurrencies.
The cryptocurrencies we compared in this analysis are the 50 largest cryptocurrencies on the market. The cryptocurrencies I will particularly focus on are the cryptocurrencies in my own portfolio.
YTD Performance
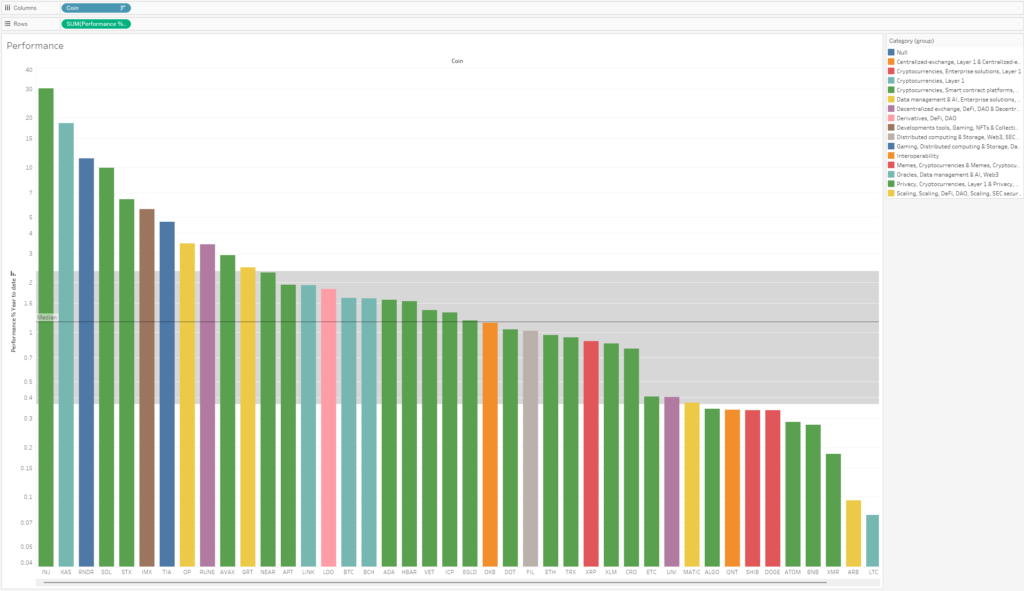
I want to start the analysis by comparing the performance of cryptocurrencies since 1 year ago. The graph is logarithmic for better visibility. Stablecoins are not included. Cryptocurrencies are grouped according to project sectors.
I used the median instead of the mean because it gave a more accurate result according to my analysis method. Investors who wish are free to use the average account.
Since last year, the median performance value has been determined as 116%. Cryptocurrencies above this level are overperforming, while those below this level are underperforming. Considering that most altcoins and Bitcoin in the cryptocurrency market have converged to each other over time and reached balance, I think that cryptocurrencies such as Litecoin and Matic, which are extremely underperforming, should rise even more.
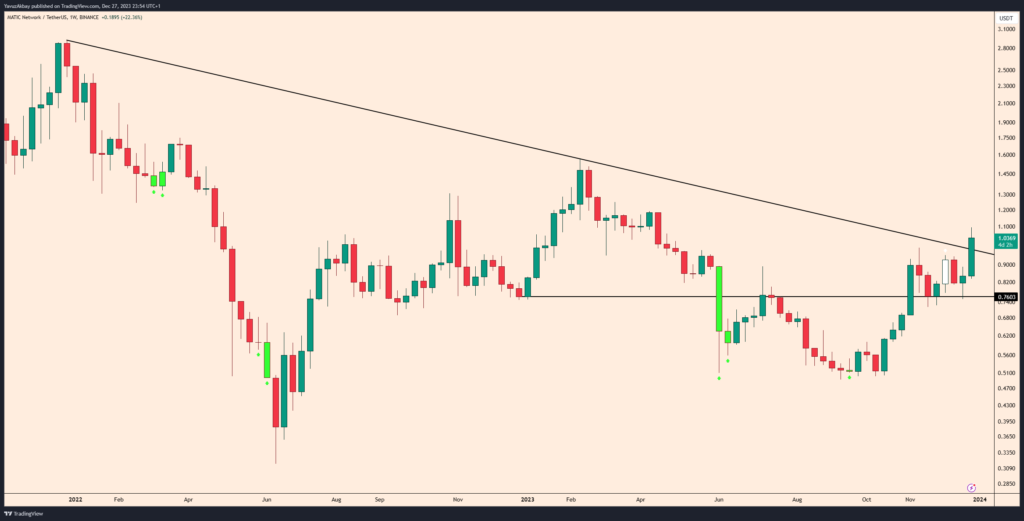
I think that Matic, which has lagged behind in terms of performance this year and has risen only 31%, will break this downward trend this week and will start to rise and run to at least $1.50. This level will complete the increase to 100% and bring it closer to the median.
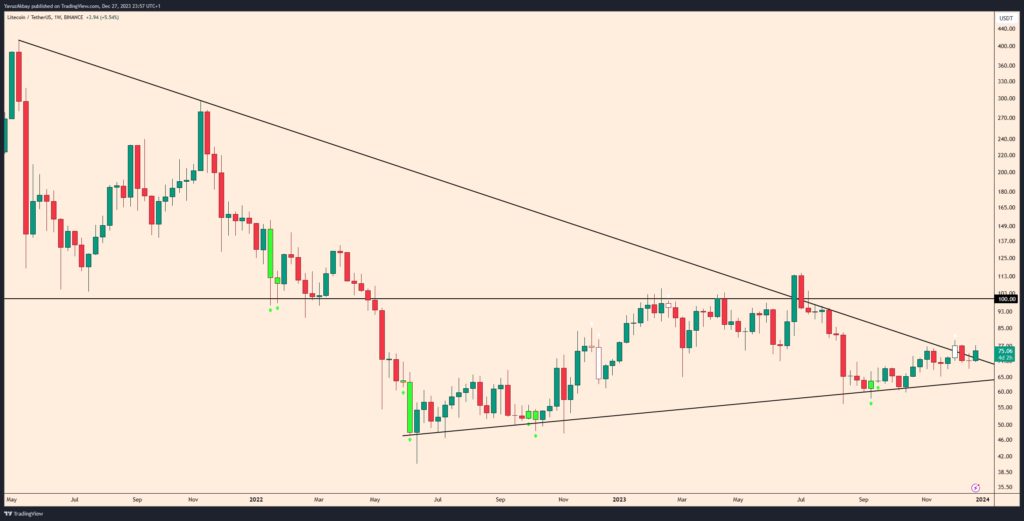
Likewise, I think that Litecoin should break this downward trend this week. In this way, Litecoin, which was extremely far from the median value of 116% by registering an increase of 0.08% last year, will increase its increase to 50%, approach the median and enter the quartile.
In this process, I think that profits should be taken, especially for cryptocurrencies such as Solana and AVAX, which are well above the media and even above the quartile.
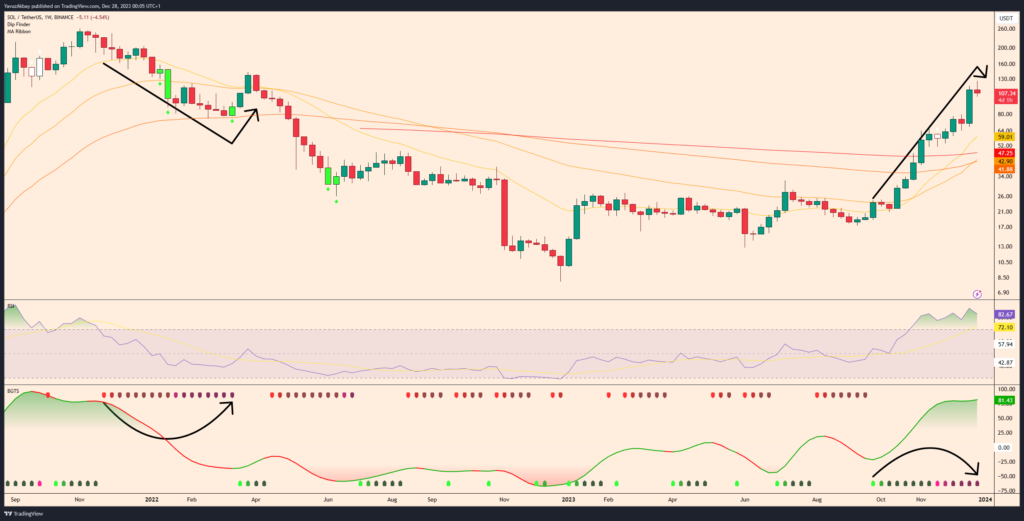
It is possible to see that this excessive rise is unhealthy, especially in Solana. The fact that the relative strength index has remained in the overbought region for weeks and the indicator I coded is also in the overbought region is one of the indications that profits should be taken in this region. I think this fix should come to at least $65. Thus, the performance, which is currently around 997%, will decrease to at least 400% and approach the quartile.
NVT
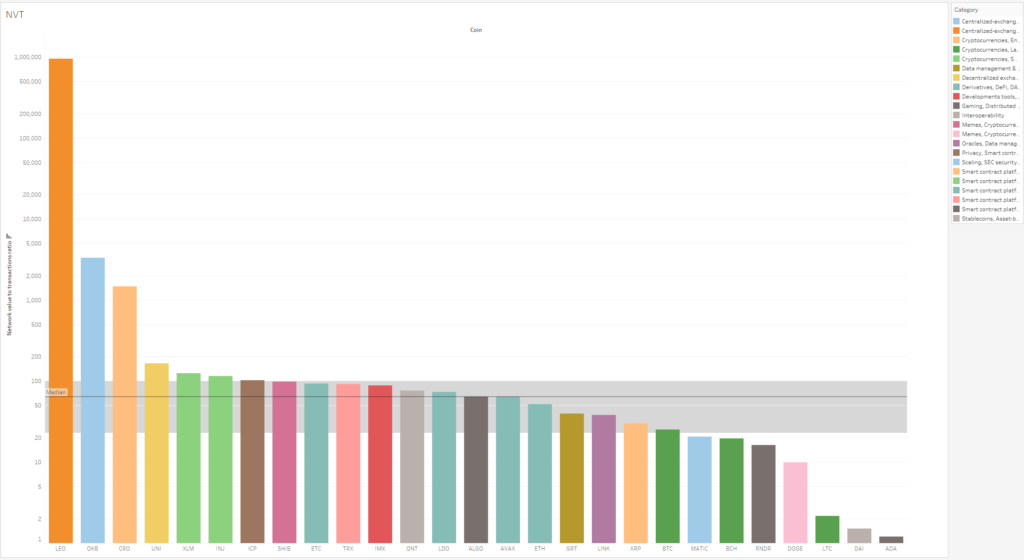
Actually, NVT is a value that needs to be understood by looking at the trend on the graph, but this graph will also help me in the current analysis. Especially the fact that XRP and BTC are in the lower quartile indicates that their values are lower than they should be. The fact that Matic and especially Litecoin are so low indicates that their values are much lower than they should be. The fact that we said the same things about the performance section further strengthens these possibilities. Unfortunately, I cannot get more information in this section since I cannot retrieve data about other cryptocurrencies in my portfolio.
Market Value / Total Locked Value
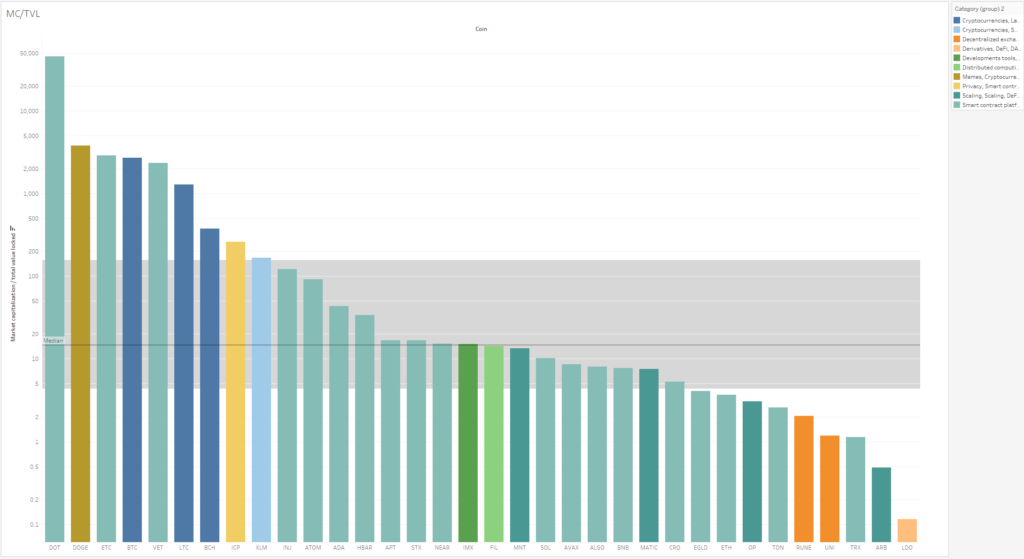
A value close to 0 may indicate that a project is very undervalued and worth looking into as a possible investment. If the value for the project is above median then this can indicate overvaluation. In the long term, however, it might still be a good investment.
Especially when I search for cryptocurrencies in my portfolio in this data group, I cannot find cryptocurrencies waiting for investment and in a region below the median. The cryptocurrencies in my portfolio are either within the quartile or very close to the median. I do not see BTC as noteworthy in this section. I will not talk about DOGE because I have said a million times that meme coins should not be invested in. Apart from these, I am particularly worried that DOT has an unnecessarily high value.
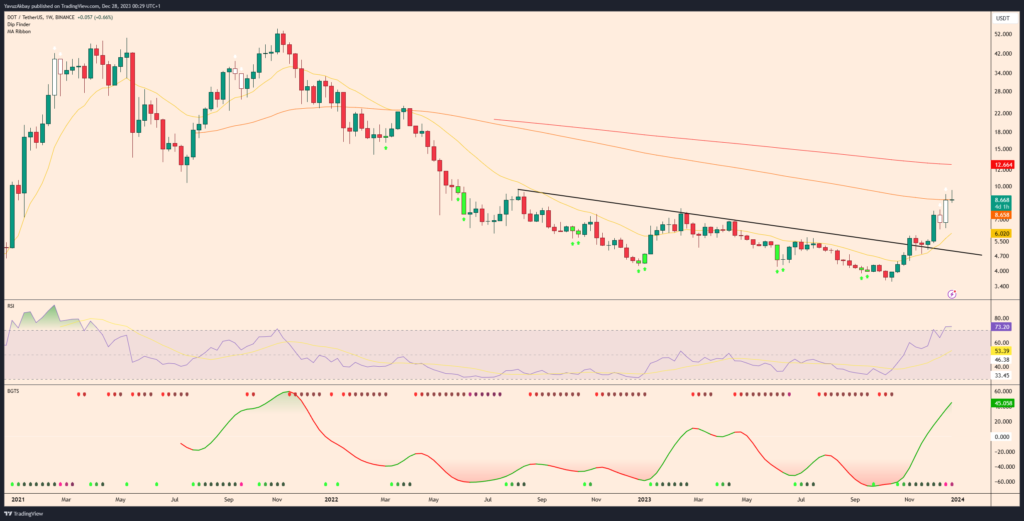
When I look at it from a technical perspective, the Dip Finder indicator that I coded has given a sell signal for DOT. Likewise, the BGTS indicator, which I coded myself, is also in the overbought region. In addition, the week has closed below the moving average. If DOT closes this week below the moving average, it looks like it will correct up to $7 for now.
Volume / Market Cap
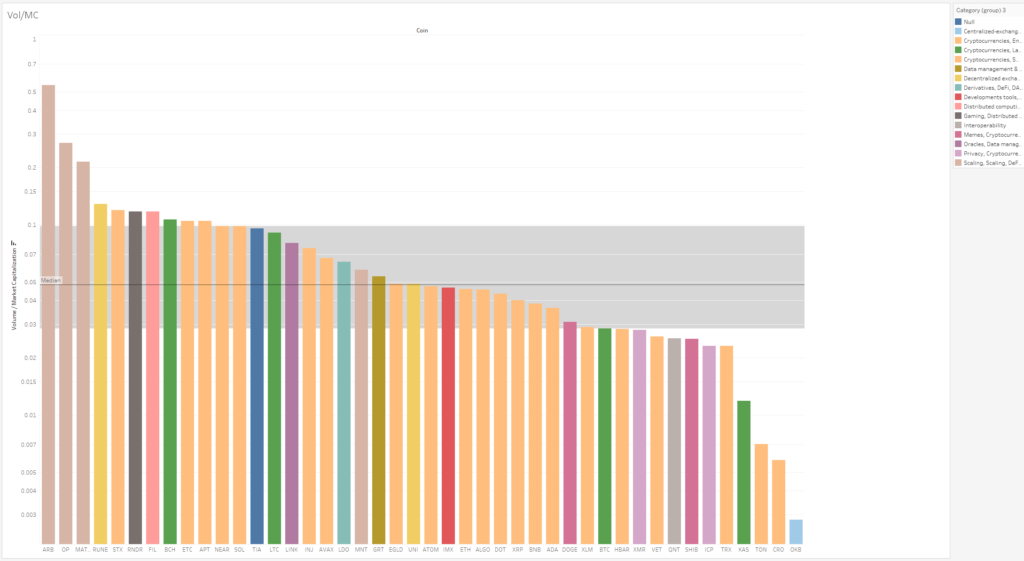
A high Volume / Market Cap ratio means high liquidity and usually a more stable market with few fluctuations in price and low volatility. Anyway, a very high value for this indicator can indicate wash trading. Low ratio is most likely mean price fluctuations, high volatility and possibility of market manipulation from the whales.
When I look at this data, I see that all cryptocurrencies in the portfolio have very good liquidity.
Profit Adresses % / Loss Adresses %
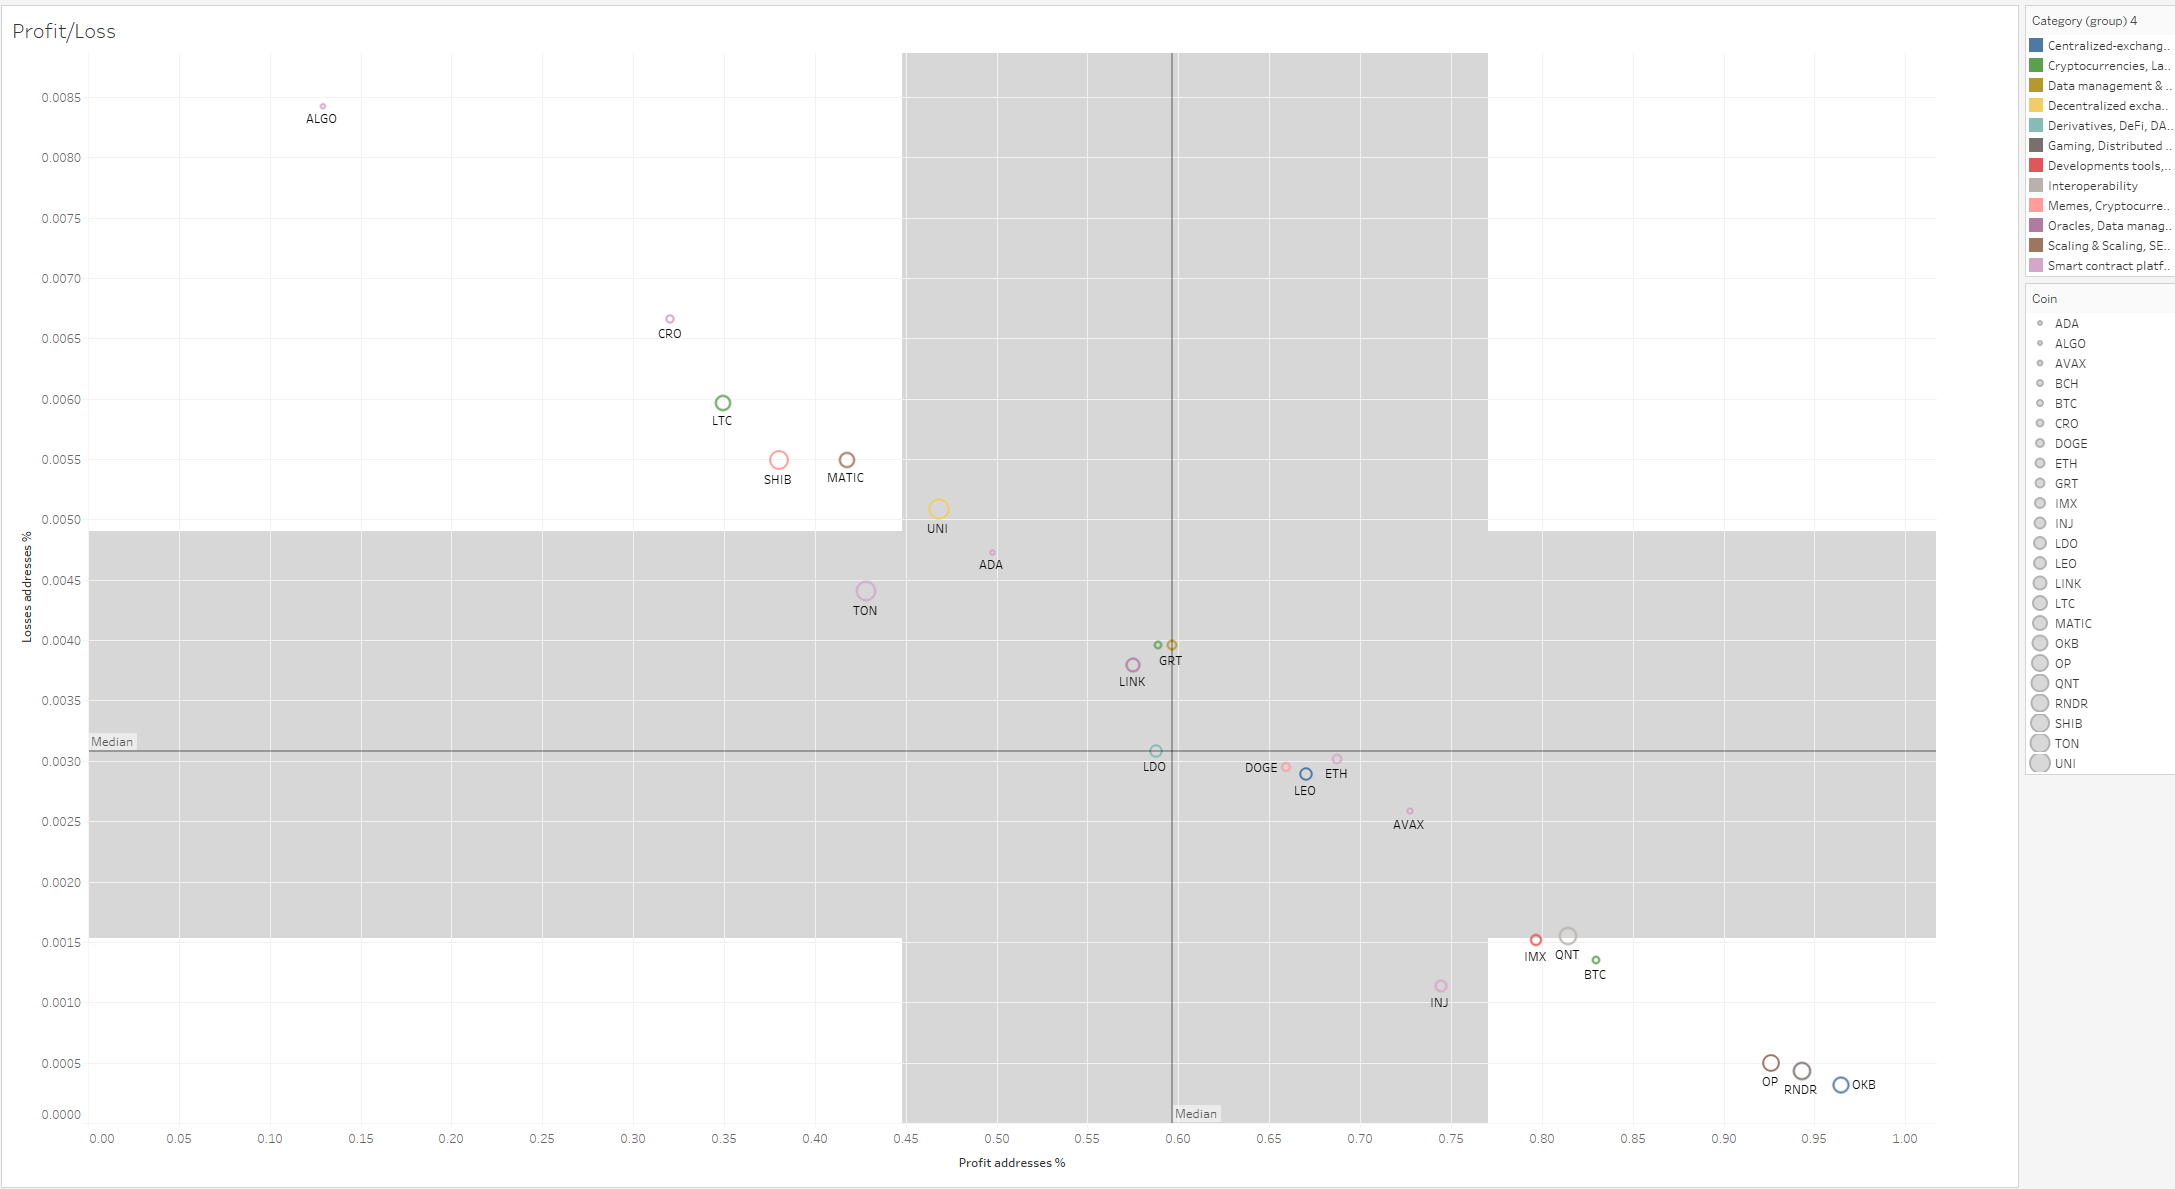
This chart is a graph of cryptocurrency addresses in loss and gain. Cryptocurrency accounts that are at a loss but close to the median are more likely to hold the cryptocurrency, while those that are making a profit are more likely to realize their profits or hold them to make more profit. The further left a cryptocurrency is, the more loss it has; The lower right it is, the more snow it means.
I especially think that Matic and LTC, which are on the upper left, will converge to the median in the coming period.