Bitcoin’s run has begun, and in this process, one of the questions people are wondering is “Where will Bitcoin find the top?” is happening. To answer this, I will use on-chain indicators and the analysis I did months ago.
The chart you see below is a small technical analysis I did on Bitcoin months ago. According to this analysis, after each withdrawal, Bitcoin continues its run by complying with Fibonacci levels. When I apply Fibonacci to the first bear season in 2014, I see that the Fibonacci level of 2.414 is the target. By some coincidence, at the end of 2017, Bitcoin rises to the level of 2,414, which is exactly what I saw in 2014. Likewise, when I apply Fibonacci to the bear season in 2018, I see that Fibonacci level 2.00 is the target in the future run. Likewise, by some coincidence, this level is reached in March 2021. When I draw Fibonacci for the last bear season, I see the target level as 1.618, that is, $ 126,000. Therefore, I think that Bitcoin’s peak in this run may be around $126,000.
So, Yavuz, why did you proceed by decreasing the Fibonacci numbers in every run? So in the first run you said 2.414, for the next run you said 2 and now you are talking about 1.618? This is because I analyze it on a logarithmic chart in the long run. In logarithmic charts, the higher the price rises, the narrower the ranges become.
So, Yavuz, is the $126,000 level you mentioned a definite level? No, of course not. Neither I nor anyone can know the future. Therefore, I use on-chain indicators to confirm this level.
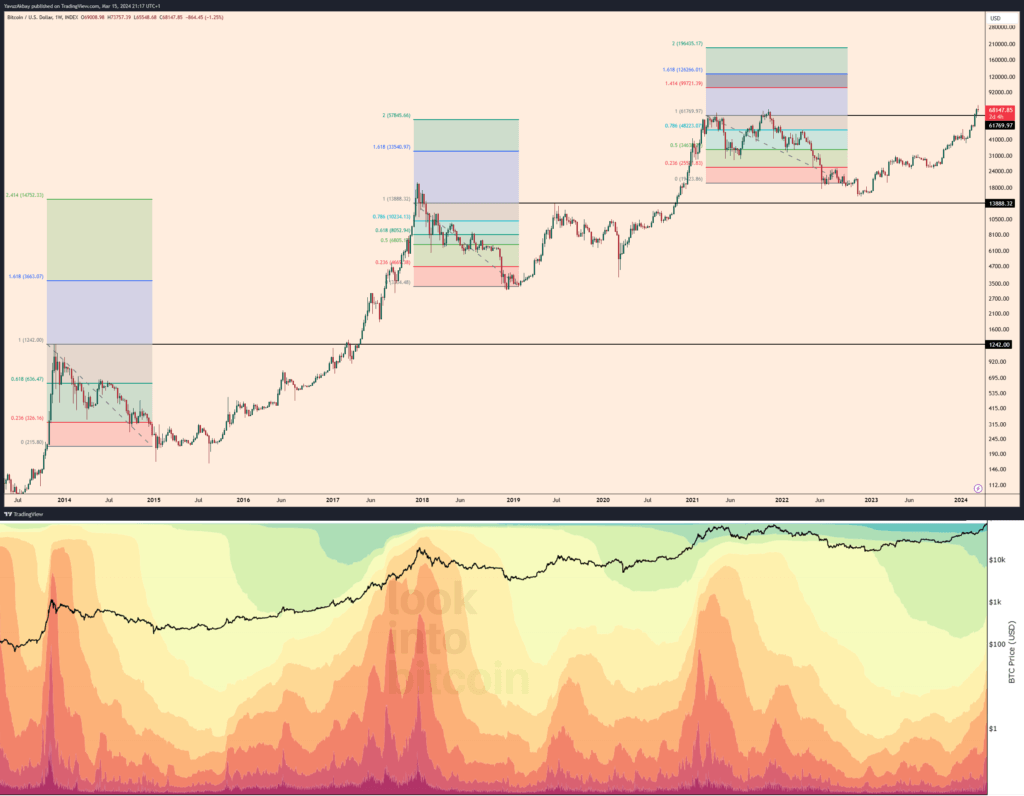
The colored chart you see above is the Realized Emission Upper Limit HODL Waves chart. HODL waves are calculated by taking into account the relative ratio of BTC supply to circulating BTC supply across various age ranges. Cool colors towards blue represent Bitcoins held in the wallet for 5 years or more, and warm colors represent Bitcoins bought and sold in less than 6 months. What I notice here is that the number of wallets that have been processed in less than 6 months exceeds 60%. When this situation occurs, the market will reach saturation.
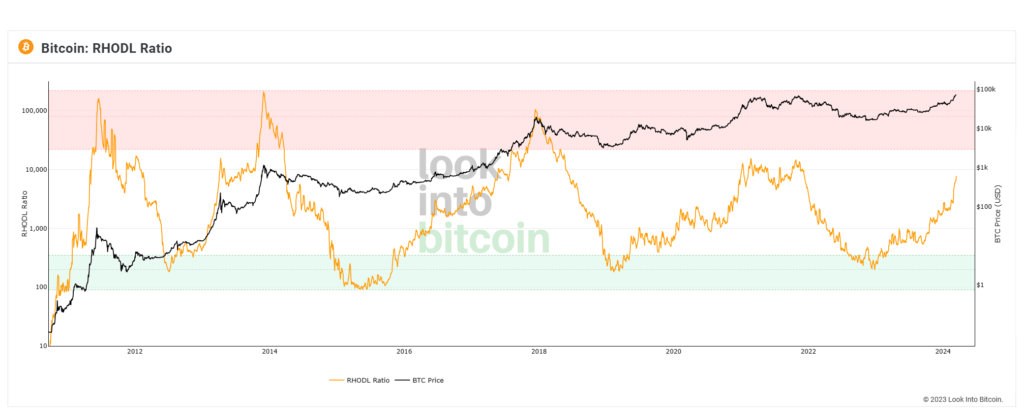
The other indicator I look at afterwards is the RHODL Ratio chart. This chart shows me the wealth transfer from investors who have been holding Bitcoin for years to new investors. We see in this chart that in the past, peaks usually came when the RHODL Ratio exceeded 100,000, but as the market matured and the global macroeconomic outlook evolved to very different places, the peak in 2021 came only when the RHODL Ratio was around 10,000. Therefore, at the moment, I will start to act a little cautiously, at least after the ratio exceeds 10,000.
Therefore, I think the peak will come at a level close to $126,000. Considering that Bitcoin is currently around $68,000, we are halfway there. During this run, I expect a possible rise in altcoins, especially when Bitcoin dominance retreats. At the moment, altcoins have not moved much. Therefore, I cannot say that it is too late for the purchase. I think altcoins will start to move in the coming months.