Today is March 1st, which is the anniversary of my starting weekly reports. 3 years ago today, I started writing my articles about financial markets on a weekly basis within Bayford Analytics. Today, the point I have reached is much different. In this article, I will talk about altcoins and introduce you to various indicators that I have developed with blood, sweat and tears in these 3 years.
First of all, as we all know, Bitcoin was traded at $25500 in mid-September. Around 5 months have passed and Bitcoin has experienced an increase of around 157%. This was not surprising to me because I had repeatedly stated that Bitcoin would reach $100,000 even when it was hovering around $15,900. But as I said, since we will be talking about altcoins, not Bitcoin, in this article, I would like to take a look at the rise of altcoins since September.
While Bitcoin is up 157%, Ethereum is up 124%; Polygon 111%; Polkadot 123%; Solana 694%; Cardano 193%; Ripple 22%; Avalanche 410%; Litecoin 34%; Chainlink has increased by 250% and finally Arkham (ARKM), which I reported would explode months ago, has increased by 449%.
So, on average, altcoins have increased very well together with Bitcoin. The two altcoins with the lowest performance here seem to be Ripple and Litecoin. If you want, let’s take a look at Ripple first:
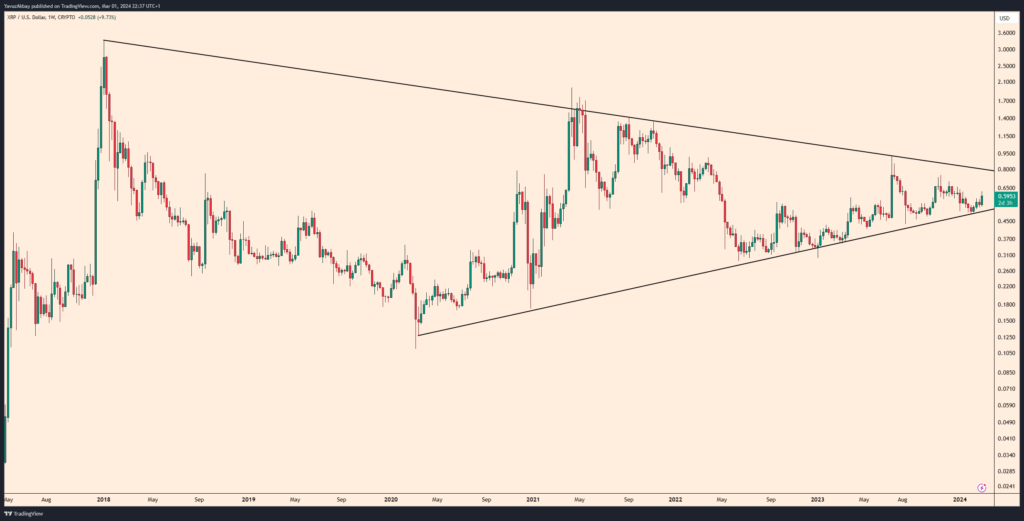
On the weekly timeframe, Ripple appears to have developed a symmetrical triangle formation. I expect this formation to break upward. Based on this expectation, I can say that Ripple’s first target will be $1.50, then $3.
Likewise, if I look at Chainlink, I see that it is making a flag formation. The target of this flag stands out as the $46 level. Therefore, I think Chainlink has at least a 100% upside potential.
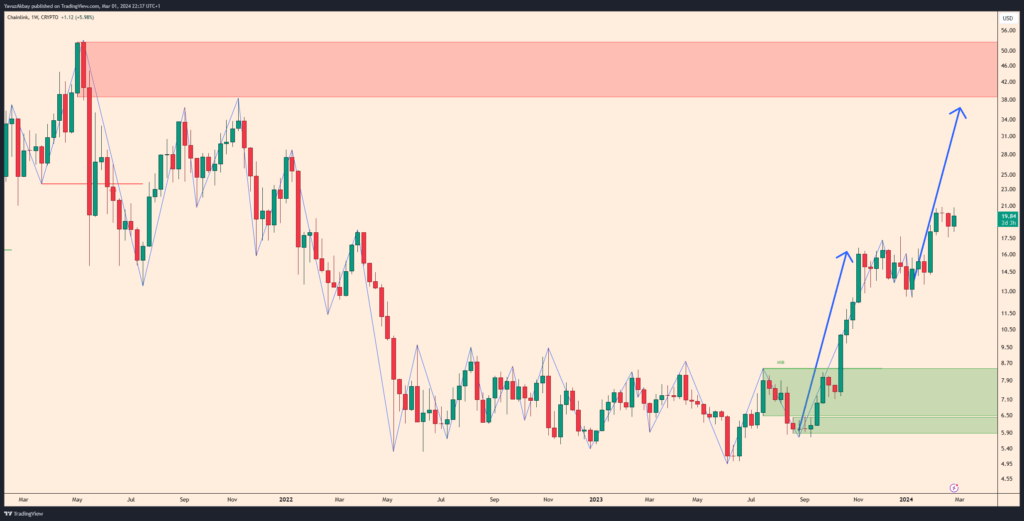
Now, I would like to tell you about the indicators that I use while doing these technical analyses, the software of which I developed using my own strategies. As an example, as you can see in the Chainlink analysis, I used Market Structure Detector (MSD), an indicator that detects zigzag and order blocks. This indicator is used to show target prices by simplifying complex pricing and determining order blocks.
The second indicator I developed is the Dip Finder Ribbon (DFR) indicator, which helps detect bottom and top levels. While this indicator determines the support and resistance points in motion, it also informs the investor by coloring the candles when the bottom and top levels are reached.
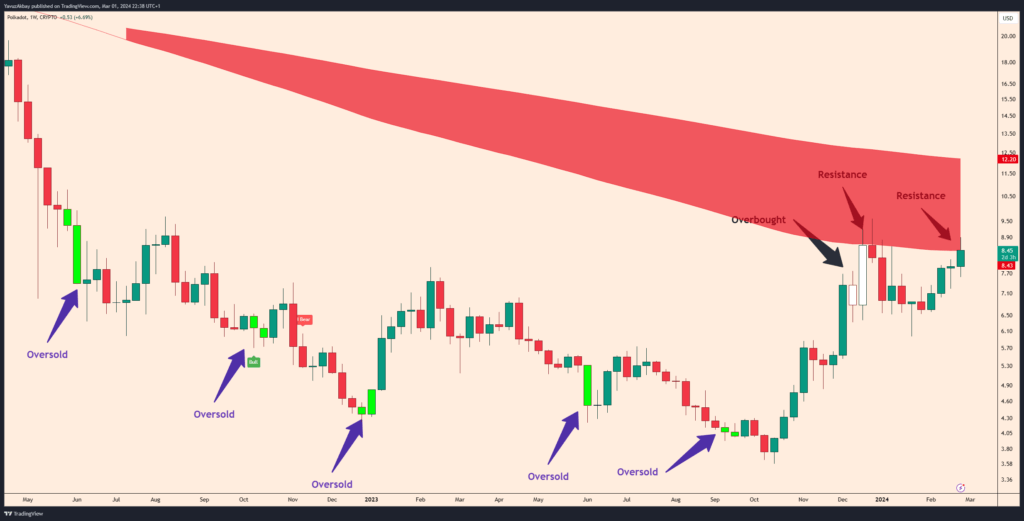
In addition, the DFR indicator informs us with colors whether the bottom has reached or not. While dark red and dark green represent decline, when the colors turn to light color, it means a return to the bull market. Thus, you can see whether the market is unstable, whether the decline will begin, etc. You can learn early. This indicator was the first indicator I developed, and I became one of the survivors of the decline in 2022 by using the strategy I created with this indicator before I developed it. Therefore, I wanted you to benefit from this information by passing it on to you.
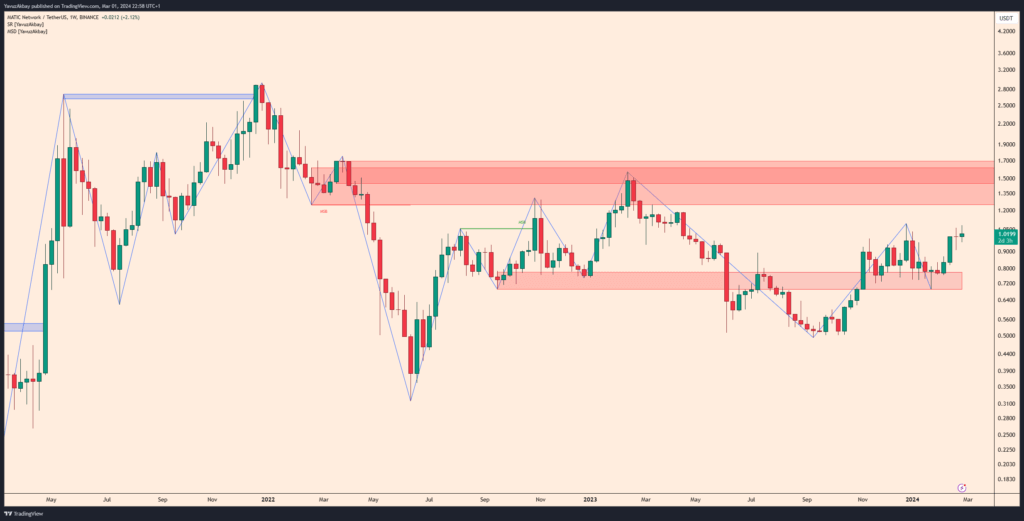
Another indicator I developed is Support and Resistance by Yavuz Akbay (SR). When you open this indicator, it shows you direct support and resistance levels. This way, you can easily find critical points for buying/selling without getting tired. When you use the SR indicator, especially with MSD, you get a result like this:
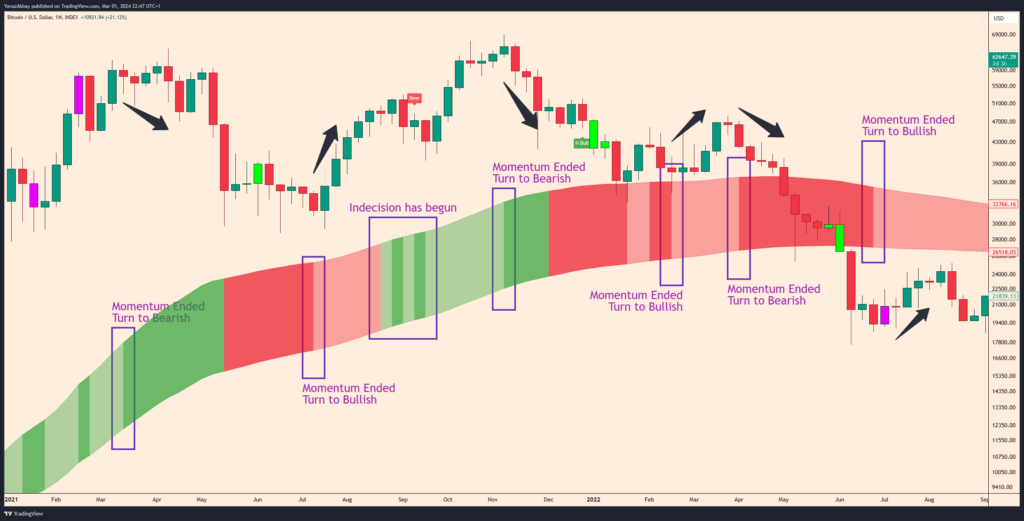
And finally, my Breakout Spotter (BS) indicator, where you can easily follow the trends. This indicator automatically draws trends for you and notifies you of the breakouts. Therefore, you can easily see where there will be an increase and where there will be a decrease. I used the Arkham altcoin as an example:
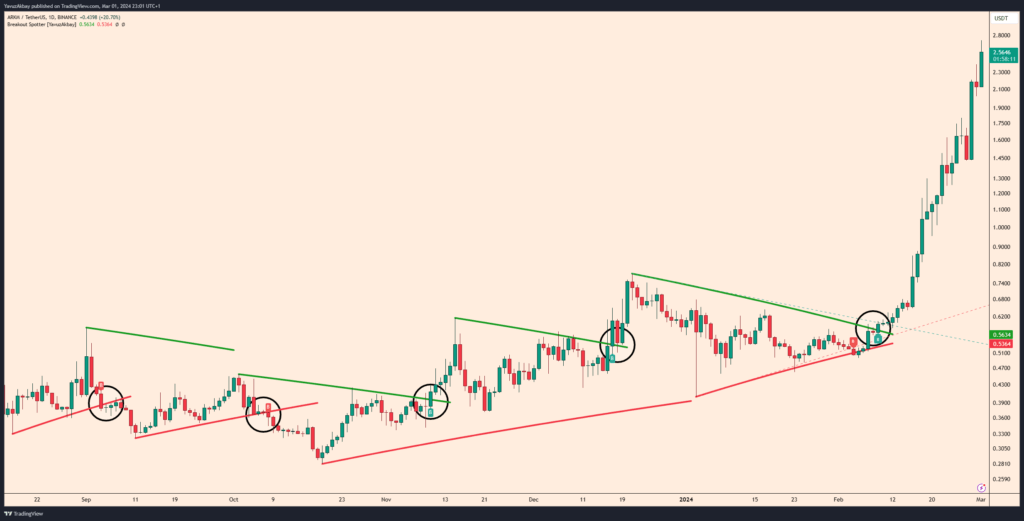
So, if you had this indicator, you would see the breakout on February 9 and have a profit of up to 358%.
So, I am celebrating the 3rd year of weekly analysis by launching my own indicators for the first time. Apart from this, I am developing 3 basic analysis indicators especially for investors who buy and sell stocks, but I will also introduce them to the market in the coming months. The strategies implemented in these indicators are strategies informed by the experiences I have gained since 2018. Likewise, I am the one who codes these strategies. I offered these indicators, which are the fruit of a development process of more than 3 years, as a monthly subscription via yavuzakbay.com/indicators. If you want, you can subscribe to the package that includes all indicators for $54.99, or to any indicator you want for $29.99. The good thing is that these indicators are 1st generation experimental indicators. Therefore, I will continue to improve these indicators according to market conditions. Therefore, even if you subscribe to 1 indicator, that indicator will improve every month and you will be able to access it without paying additional fees. In addition, package subscribers will be able to access new fundamental analysis and similar indicators that I will publish. I aim to make the indicators more compatible with artificial intelligence and provide more accurate results in the coming months.
So, I am celebrating the 3rd year of weekly analysis by launching my own indicators for the first time. Apart from this, I am developing 3 basic analysis indicators especially for investors who buy and sell stocks, but I will also introduce them to the market in the coming months. The strategies implemented in these indicators are strategies informed by the experiences I have gained since 2018. Likewise, I am the one who codes these strategies. I offered these indicators, which are the fruit of a development process of more than 3 years, as a monthly subscription via yavuzakbay.com/indicators. If you want, you can subscribe to the package that includes all indicators for $54.99, or to any indicator you want for $29.99. The good thing is that these indicators are 1st generation experimental indicators. Therefore, I will continue to improve these indicators according to market conditions. Therefore, even if you subscribe to 1 indicator, that indicator will improve every month and you will be able to access it without paying additional fees. In addition, package subscribers will be able to access new fundamental analysis and similar indicators that I will publish. I aim to make the indicators more compatible with artificial intelligence and provide more accurate results in the coming months.
I tried to bring the prices to the lowest possible level, but that was all it could be. This is because it covers the costs of developing the indicators for 3 years. (A little tip to my followers: When I sell 134 indicator packages, the expenses are covered.) However, at the end of the article, I would like to thank my followers, especially those who follow my blog, by giving them a discount code for my 3rd year. You can get a 20% discount with the code “AKBAY20”. See you in my other articles.
DISCLAIMER
All indicators in the indicator package were designed and coded by Yavuz Akbay with support from Yavuz Akbay’s strategies. The rights of all indicators in the indicator package are reserved. The indicator package is designed to be used on the Tradingview platform. The indicator package is for one person. The user who purchases the package agrees that he/she will not reverse engineer this software; It will not share the software or the outputs of the software with third parties in any way, visually, audibly or in writing; If the user who purchases the software is found to have shared the software, he/she is deemed to have accepted that his/her access to the software will be immediately cut off and legal action will be initiated.
Trading is risky, and most traders lose money. These indicators Yavuz Akbay offers are for informational and educational purposes only. All content should be considered hypothetical, selected after the facts to demonstrate the product, and not construed as financial advice. Decisions to buy, sell, hold, or trade in securities, commodities, and other investments involve risk and are best made based on the advice of qualified financial professionals. Past performance does not guarantee future results.
Hypothetical or simulated performance results have certain limitations; unlike an actual performance record, simulated results do not represent actual trading. Also, since the trades have not been executed, the results may have under- or over-compensated for the impact, if any, of certain market factors, such as a lack of liquidity. Simulated trading programs in general are also subject to the fact that they are designed with the benefit of hindsight. No representation is being made that any account will or is likely to achieve profits or losses similar to those shown.
This does not represent my full disclosure. Please read my full disclaimer.