Bitcoin’s price has surpassed $50,000, driven by increased interest from mainstream investors due to the launch of bitcoin exchange-traded funds (ETFs) and regulatory changes. Despite a temporary dip after the approval of spot bitcoin ETFs by the US Securities and Exchange Commission (SEC), the cryptocurrency has seen significant gains. The approval of these ETFs has led to inflows of around $3 billion, signaling growing demand for bitcoin among traditional investors. Optimism is also fueled by regulatory clarity and expectations of central banks lowering interest rates, making risk assets like Bitcoin more attractive.
Consider the proportion of total supply owned by LTHs that is in loss. At the bottom of bear markets, LTHs typically shoulder the majority of unrealized losses as speculators exit the market and the ultimate capitulation results in a significant transfer of coin ownership to strong conviction holders.
In contrast, during the early stages of a bull market, this indicator tends to achieve continuously lower lows as the rising market rises and turns all LTH supply into profit. This indicator looks to be following a similar trend so far, momentarily going below 60% during the last decline to $38k.
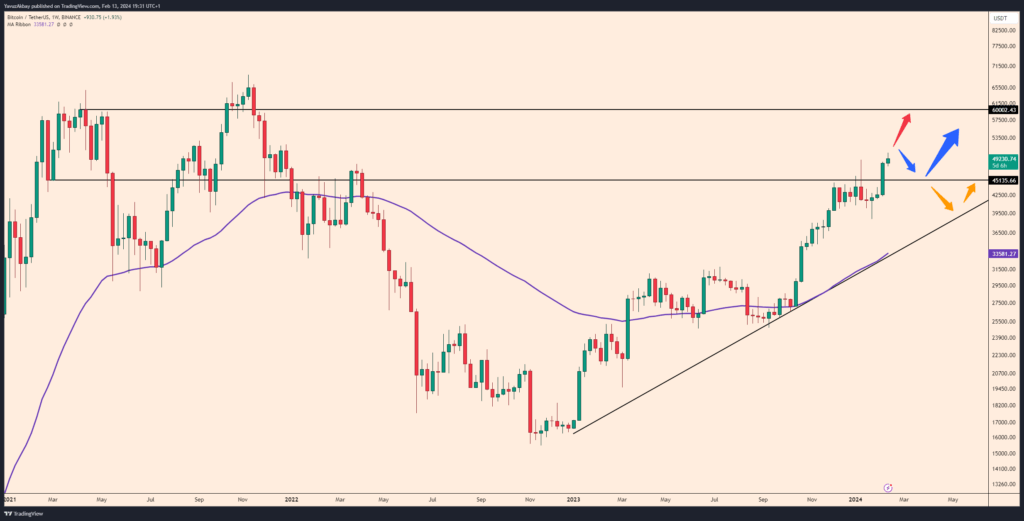
Therefore, I can understand from this that Bitcoin is preparing for an upward explosion as the halving approaches.
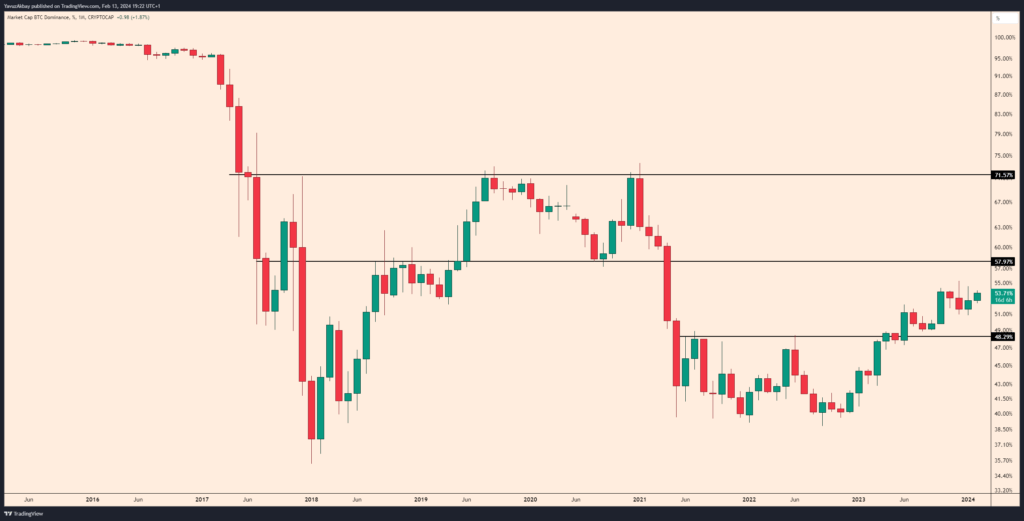
When I look at the Bitcoin dominance chart, I see that the dominance is slowly increasing to 58%. I think this level will be reached in the coming period and then, if the resistance is reversed, we will see a jump in altcoins. When I look at the Bitcoin dominance chart, I see that the dominance is slowly increasing to 58%. I think this level will be reached in the coming period and then, if the resistance is reversed, we will see a jump in altcoins. But I think that for Bitcoin to stay above $100,000 permanently, the dominance must exceed 58%. After Bitcoin jumps above 100,000, although the dominance drops below 58% again, Bitcoin will pull up to a maximum of 60,000. The issue on which I base this opinion is that Bitcoin ran from 3000 to 10000 in 2019 and the dominance reached 71% in this run. As long as the dominance remained above 58%, we saw Bitcoin run to 50,000s, and only when it fell below 58% did Bitcoin see 20,000s in the past years. Therefore, the dominance chart is one of the most important factors determining the price stability of Bitcoin.
When we look at the price chart of Bitcoin, I see that the price exceeded $45400 in the weekly time frame. There are 3 scenarios here, but the target appears to be 60k in all 3 scenarios. But no matter what, the issue I will pay particular attention to is the trend (also the moving average).